Every market's next turn, in one place
See which markets are projected to turn soon, which ones turn together, and how each one's cycles compare with its seasonal pattern — across all 113 US-listed markets we cover, updated every night.
Already a member? Sign in. Cancel any time from your account. Subscription terms
You're a Premium member: every market opens for you. Your account
We'll write once, when Premium opens. No newsletter, no spam, and your address is deleted afterwards. How we handle it
- Full charts for each: the market's own line with its turns, the cycles, projected turns with their ± window, scalogram and 3D surface, updated every night
- Markets: every market's next turn on one page, soonest first
- Calendar: every projected turn of the next three months, day by day, plus the last two weeks' turns
- Rhythms: which markets share a rhythm and turn together
- Seasonality for every market: the seasonal chart next to its measured cycles
- Favourites, on up to 3 devices
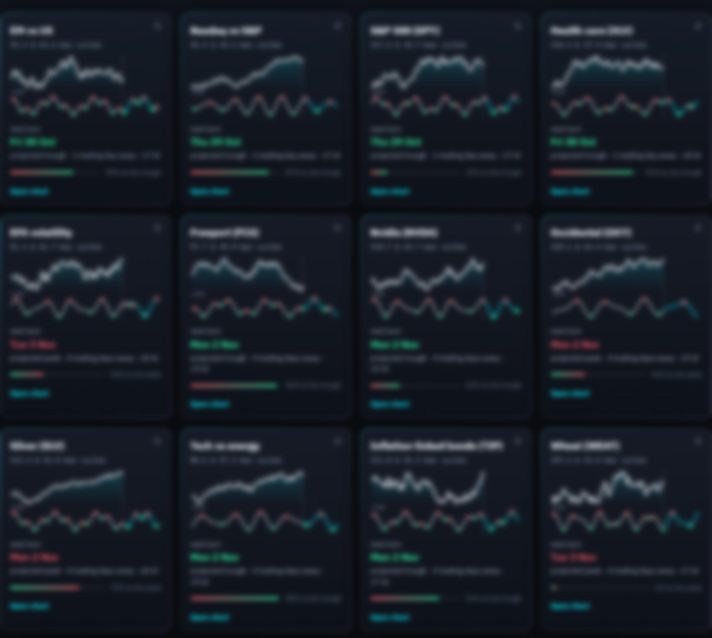
Markets — every market at a glance: its cycle, its next turn and how close it is, the soonest first.
Open Markets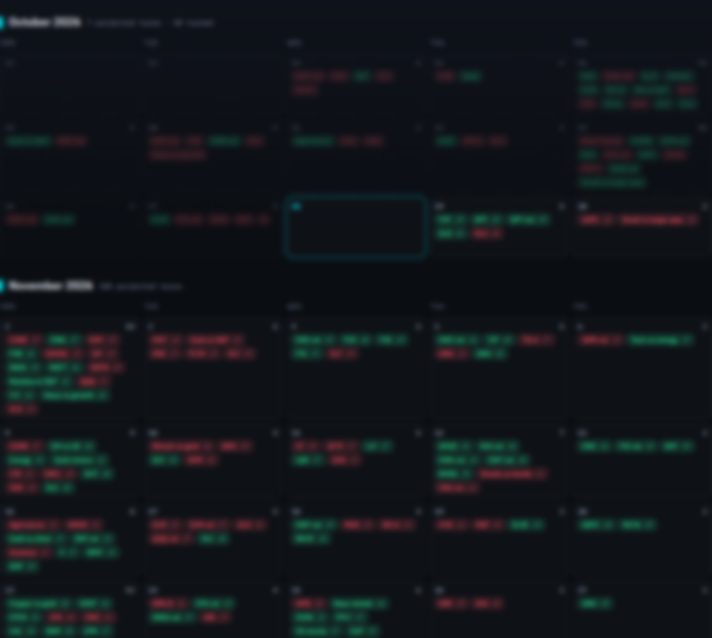
Calendar — every projected turn of the next three months, day by day, plus the last two weeks' turns. Filter by group or by your favourites.
Open Calendar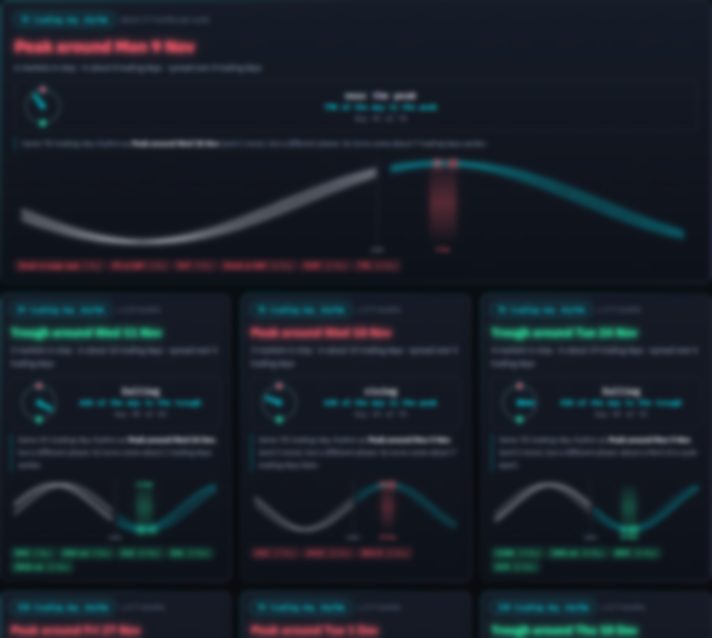
Rhythms — markets that share a rhythm and its timing, so they turn together.
Open Rhythms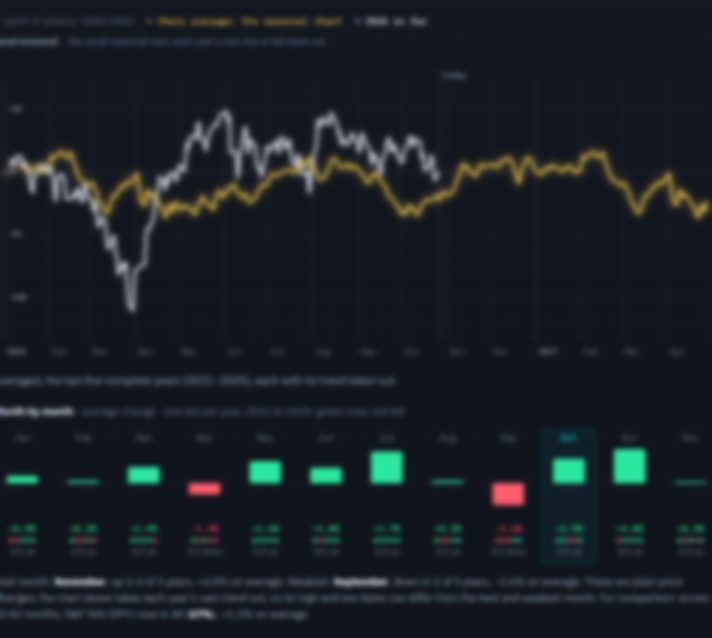
Seasonality — the seasonal chart and month-by-month table for every market, next to its measured cycles.
Open Seasonality